

Servato exhibited at both the MTA Annual Convention & Showcase and the URTA Annual Convention this week alongside our partners, Power Product Services. We enjoyed getting to meet so many new people and look forward to being back to Utah and Minnesota soon! If you want to learn more about what we are doing at Servato, you can find online material here.
[…]
The year of evolution came to a close last week for the Servato team. The team traveled thousands of miles spreading the message of managed DC power, developed multiple new products, announced customers and partnerships that invest in hardening the networks in their communities, and spoke at conferences across the country including ISE EXPO in Denver, CO.
[…]
VP of Sales Eric Hedlund exhibited and spoke at the Oklahoma Telephone Association Technical Conference this week in Tulsa, OK. OTA does a great job of engaging their members on a consistent basis with frequent updates of product innovation and industry news. Servato will also be attending the MATSS show in October through our membership with the Oklahoma association.
Mr. Hedlund presented on Adaptive Charging, the technology advancement that is now fundamental to our ability to double battery life. He spoke in detail on how this approach has not only saved carriers money across the country but also serves as the gateway to unlocking data insights that you can not get unless your rest your batteries. It was a great opportunity for customers and new attendees to also learn more about how to prevent network outages and ensure network reliability, especially after the bout of thunderstorms the area has received in recent years. If you want to learn more about how our approach works, feel free to download our eBook today.


At ISE Expo in Denver last Thursday, Servato's very own Chris Mangum spoke with a room of people on how data empowers carriers to become more actionable, particularly technicians. Later that day Tech Talk panelist, Ken Paker of TDS, spoke about a similar topic that highlighted how internal processes and teams can be made more efficient. More intelligent decisions for network reliability are becoming ubiquitous as data accumulation has made the most niche problems now more efficient.
[…]
The Servato Sales team has been all over the country meeting with customers this past month, and a big part of that travel is showcasing our products at conferences.
We have gone from Branson, MO ⇒ Franklin, TN ⇒ Lake Lanier, GA ⇒ Charleston, SC
and are proud to have been able to support the following associations through exhibition and sponsorship:
- Oklahoma Telephone Association
- Arkansas Telecommunications Association
- Tennessee Telecommunications Association
- Fiber Network Alliance
- South Carolina Telecommunications and Broadband Association
- Carolina-Virginias Telephone Member Association
The highlight of this month must have been CEO, Chris Mangum, giving a talk on How Everyone Plays a Part in Backup Power. If you want more information on that discussion, you can contact bdavenport@servatocorp.com for more information.


VP of Sales Eric Hedlund attended the CommTech West Show this week in Calgary, AB. The CommTech series hosts the premier telecom events in Canada, and we're glad we had the opportunity to be at both East and West this year.
Eric Hedlund presented again at the show on Disaster Recovery & the Importance of Backup Battery Power. It was a great opportunity for new and old attendees to learn more about how to prevent network outages and ensure network reliability. If you want to learn more about other disaster scenarios especially prior to hurricane season, click below.


VP of Sales, Eric Hedlund, will be headed to Palm Springs on Monday to join Solara in booth #213. The Utilities Technology Council hosts this premier event for anyone looking to learn about the latest technology, policy changes, and numerous other workshops.
Servato's partner at this show, Solara, is an industry expert in defining power and backup battery systems for utility providers. Come by the booth during the show to learn more about how Servato can fit into that design!
[…]
New Orleans, LA 1:30 on 4/13/2018
[…]
Like many other people, I have been thinking a lot about the White House’s proposal over a month ago for federal infrastructure spending. $200 billion over the course of the upcoming decade to ostensibly spur an additional $1.5 trillion from local, state, and private investment. I do not intend to sound skeptical, but rather curious, and in particular, about the Rural Infrastructure section (Part I, Section II). After all, it is a highly publicized figure that needs a little more unpacking.
I want to try and predict how much potential impact this stimulus could really have on sparsely populated corridors of our country. Being on the business development team for Servato, the battery management data platform, I wanted to understand how our rural customers will be impacted. Throughout this document, I run best-fit regressions and time-series models to get rounded figures for comparison. There are several moving parts of the document that I will simultaneously highlight as I dive into the analytics, so bear with me.
TLDR: Infrastructure spending will easily outpace the goals set in place by the proposal. The overall market will expect a $1.73 trillion private investment with the rurally-defined population experiencing $1.12 trillion of that investment over the course of the next 10 years.
What is the Plan?
First of all, $50 billion of the $200 billion is allocated towards rural infrastructure programming. Eighty percent, or $40 billion of this subset is designed to go straight into state government budgets during the next decade via block grants. Each entity will then use a to-be-announced “rural formula” capital function to allocate funds. These functions’ input rural lane miles alongside policy objectives to determine where to place funds. The remaining $10 billion will then fall on the shoulders of merit, allowing stronger performing states to apply for additional funding.
The next element to address is distribution. Populations of less than 50,000 people serve as the first filter in determining what municipalities are eligible for application. Figure 2 shows that there are, maybe unsurprisingly, a large share of cities that qualify to put forth a project proposal to their respective state overseer. For the purpose of this analysis, I will assume that every potential benefactor, 39,619 cities, has the same level of interest in pursuing capital (see Figure 1). An important side note to make: each state government also has a minimum and maximum allocation, so no one state can receive all or none of the money.
Based off of this distribution, Figure 2 shows an apparent advantage that certain states should have over others. For example, all of Wyoming falls in the rural category; whereas, half of Massachusetts does not.
Lastly, the models that unpack how I get to these figures are not dependent on past federal stimuli and the proposed amount. There is simply too much variability in relating promised contribution, actual contribution, and actual investment to drum up any correlations. With that, I specifically use historical data in the industries’ private investment, average expenditure per citizen, and the rural portion of my predicted overall private investment.
The Past: Best Fit
There are five listed categories of rural infrastructure eligible to be upgraded in the White House’s outline including: Transportation, Broadband, Water and Waste, Power and Electric, and Water Resources. These categories encompass a breadth of projects that could range from airport construction to flood risk management (e.g. levee system) to cell towers.
Let’s take an in-depth look at the historical private investment of each, along with the best-fit regression of each total, to better understand the size of these industries during the 20th century and beyond. Where appropriate I segmented the data to show where money goes. The available data cited in each figure runs from 1901–2016 and represents the entire United States. Ultimately, we want to look at the impact of new federal funding on ruralinfrastructure, so we must look at this data with some expectations of variation.
Investment in the transportation industry reached $14 billion at its peak in 2015. Figure 3 shows how Track Replacement, the equivalent of Rail Upgrades and Maintenance, has driven this growth ever since its inevitable collapse in the 1970s, only to be saved by the Staggers Rail Act of 1980.
Investment in the communication industry peaked at $27 billion in 2006. Figure 4 shows the sharp 5-year drop after the Great Recession when investment bottomed at $16 billion. More connected devices and higher bandwidths will likely fix this curve back upwards through future fiber builds and technology investments to support these latent-focused networks.
Investment in the power/electric industry reached an astonishing $252 billion in 2013. Figure 5 shows how, similar to the transportation industry, a single industry segment can drive growth and contraction — in this case, petroleum and natural gas. Important to note, this segment was also adversely affected in 2008.
Investment in the Waste and Water industry reached its peak in 1991 at $1.8 billion and has greatly fluctuated over the course of the past 40 years. This drop-off follows the large investments that supplied urban water projects such as the New York City Water Tunnel to allow for cleaner drinking water and sanitation. Unlike the other industries, there is no apparent trend that can be derived from Figure 6.
Investment in the Water Supply industry also reached its peak in 1991 along with the Waste and Water industry at $1.7 billion, which makes sense. With this, we now at least have an asset segment with comparable fluctuations as you see in Figure 7.
These visualizations drive home several key points. We had relatively no private investment before every category began to pick up steam in the late 50s and early 60s. Transcontinental communications, Eisenhower’s Interstate System, and distributed energy all fueled the rise of a powerful national economy. Local and regional economies bursted onto the scene as well as to fulfill the impending contract work for this infrastructure. Reverberating economic effects followed soon after creating suburban retail and restaurants jobs that laid the bedrock for today’s middle class. It is also easy to piece out economic fluctuations such as the Dot-com bubble or Great Recession signifying that these historical moments’ impact continues much further beyond doomed internet startups or failing investment banks.
What Does This Mean?
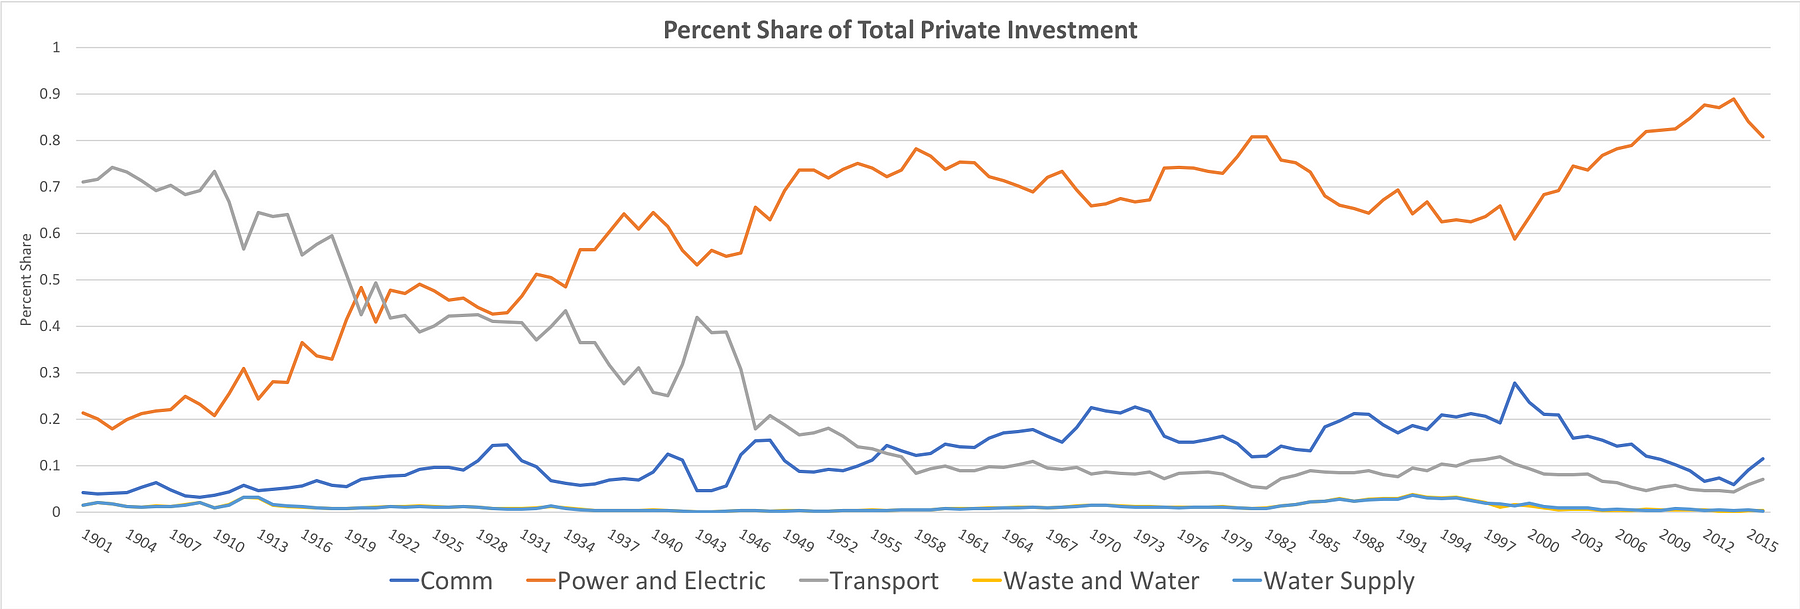
With that, we now at least have a general understanding of what past private investment has been for these infrastructure categories. These figures do not include federal contributions and are not earmarked for a particular purpose giving a clear picture of distinct private investment. In order to predict what final spending will be during the next decade, a share of expenditure needs to be calculated between the five. Why so? Because entities will be competing for dollars, thus, the visual in Figure 8.
I think you should remind readers here that the gov money is not earmarked for any purpose but that it can go to any category at the states’ discretion.
Dig down into these numbers by looking at Table 1.
The steady decline of transportation and incline of power over the course of the 20th century are reflections of consumerism. Roadways, airports, and railways are even more so fixed assets than Power and Electric because the pervasive infrastructure is shareable to many more people, thus garnering more individual utility than say the last 100 feet of copper that is only powering your home. Take for example I-75 that runs the height of the country from Miami to the Canadian border. It required massive investment from its inception in the early 1960s, but departments of transportation have been merely maintaining it since the final leg of it was completed in 1992.
On the other hand, the housing market of Nashville has demanded the attention of electrical system installations to keep up with the burgeoning populous. One hundred people move in every day on average holding constant for births and deaths. The spillover into surrounding suburbs accounts for almost another one hundred people moving in per day as well. Effectively, the residential and commercial real estate being built is almost tailored for this influx and thus effecting a smaller portion of our population.
Waste & Water and Water Supply are almost a perfect fit, so it is hard to make out the former in Figure 8; regardless, it is a small share of the sample, so we are not drawing any major conclusions from its percent share. What about Communication? It seems to be difficult to visually pin down a long-term trend for its share of this market. Let’s continue on to find the answers.
The Past: Time Series
In order to best determine how to predict the next 10 years, polynomic equations are pretty good models for forecasting. However, there is a lot of fluctuation that occurs for the model to recognize that the order is actually larger in each infrastructure segment. And of course, this is a univariate analysis because time is not necessarily a good indicator of investment. So, I also took the moving average of each total. This way, I was able to use a simple linear regression to obtain coefficients for the slope and intercept, and effectively, have a trend that I can control for 10 years into the future instead of a somewhat arbitrary forecast.
This lead to time-series models. There was no apparent seasonality or irregularity that could be held constant from the data, so I am not displaying any additive or multiplicative modeling. Given the low levels of investment in the first half of the 20th century, you could probably imagine that a model predicated on the entire century would be highly inaccurate. I decided to switch the time period to now reflect the rise of the national infrastructure economy by starting with 1953.
What Does This Mean as Well?
As previously mentioned, this predictive model starts in 1953 instead of 1901. This is by no means a perfect model, and more accurate models would call for multitudinous linear regressions; however, we are only trying to deliver a ballpark figure. Visually, this subsection of data makes sense considering the accelerated growth of the ‘Actual’ data in each segment around that time. 1953 is also the year that Dwight Eisenhower took office and three years later implemented the Federal Aid Highway Act of 1956 to help catalyze the Interstate Highway System. Again, not a bivariate analysis but recognizing this point in history is important for positioning this visualization. Other infrastructure categories effectively exploded because the developing transportation backbone made way for residential and commercial real estate alongside the highways that snake throughout the United States. These buildings then all call for elements of the other four infrastructure categories, allowing for growth in every segment.
Dig down into these numbers by looking at Table 2.
The model shows that there will be an overall decline in investment with an increase in Communication, Waste and Water, and Water Supply. An increase in focus on broadband extension projects from telecommunication and utility providers gives grounding to the Communication piece. The latter two may be a function of maintenance projects needing to be instigated to support the spike that occurred in the 80s and early 90s. A recent article by The Washington Post paints a daunting picture to how this could come in the form of unhealthy levee competition along the Mississippi River. Climate change also is a large factor specifically around the Gulf South, read more here from Brett Anderson on how Louisiana swamps and marshes and the Mississippi River have been impacted. Whatever the case may be, let’s move onto the rural segmentation and White House Proposal piece.
Investment in You
At first glance, these figures look disappointing. But, we are not done yet! Let’s now apportion infrastructure spend back to only our rural target (remember we have been looking at data for the entire country) and then loop in assumptions based off the White House proposal.
We learned from Figure 2 that there are a small quantity of cities with populations above 100,000. We know from the National Association of State Budget Officers, that states with one of the largest 100 cities spent only $2,605 per citizen in 2015. That is 49% of those states’ averages of $5,237, a small fraction. Infrastructure, for city and state budgets, is the most influential for expenditure per capita which creates a good indicator for our final prediction, whether that is negative or positive.
We also know that rural populations traditionally made up about 20% of America today or 64.9 million people. I have a take here on how that percentage will increase from the influx of new technologies and adoption of slightly-aged ones, but we will hold percent change constant for simplicity. However, the Proposal’s definition of rural populations (< 50,000) actually sky-rockets this figure to 47.9%. The aforementioned large cities that commit about half as many funds per citizen make up 9.1%. With that, we now have equations to determine how much of private infrastructure investment goes to “rural” populations.
· Rural Investment:
· Urban Investment:
· Proposal Projections:
The rural allocation for 2016 is an impressive $86.9 billion largely due to the redefinition of this demographic and partially my assumptions. If we linearly and proportionally scale this out to our 2028 Forecast 2, we end up with the following Investment schedule in Table 3 compared to the advertised $71.85 billion that this Infrastructure plan is insinuating will be invested into rural populations. Overall, these numbers are a product of an estimated $1.73 trillion investment throughout the 10 years in the entire infrastructure plan.
There are several assumptions made in this analysis to get to these numbers; however, I believe the bigger takeaways are unaffected. The proposal is extremely conservative. Not only from the rural perspective, but our original data of $189.9 billion for the entire country in 2016 versus an average of $150 billion, gives the impression that we will easily reach these goals, barring any significant policy changes.
Well, there actually has been one included with the Proposal. The 50:50 ratio used in the past for federal contribution is now dialed down to 20:80. This could be problematic for larger projects but will allow for larger engagement in smaller, maintenance-focused ones. Some city mayors have vehemently disagreed with the new ratio and are genuinely concerned with how their municipalities will push projects forward. Regardless of your fiscal policy preferences, the proposal is not gaudy. The bigger questions quickly become:
· Does the rural population get the same attention that urban areas are given?
It should base off the data supporting the infrastructure : citizen expenditure.
· Does the new federal contribution ratio spur numerous projects that blow these figures out of the water? Or does it cause many state, local, and private entities to get cold feet?
This remains to be determined of course.
· What does the rural formula capital function end up looking like?
This could be a political modality as imbedded in systems such as gerrymandering for all we know.
If you have any feedback about this model or thought-process, do not hesitate to reach me at bdavenport@servatocorp.com
[…]

Big news! Servato representatives CEO Chris Mangum and VP of Sales Eric Hedlund will be attending the CommTech East Show next week in Mississauga, ON. The CommTech series hosts the premier telecom events in Canada, and we're excited about the opportunity.
Eric Hedlund will also be presenting at the show on Disaster Recovery & the Importance of Backup Battery Power. It will be a great opportunity to learn more about how to prevent network outages and ensure network reliability.
[…]